Airbnb occupancy rate is the share of bookable nights that were actually booked, and the right target depends on your market, season, property type, and pricing strategy. A full calendar is not automatically a healthy one if low rates, frequent turnovers, or weak margins are doing the work.
The useful question is not, “What percentage should every Airbnb host hit?” It is, “Is my occupancy strong for comparable listings, and is it producing the revenue and workload I actually want?”
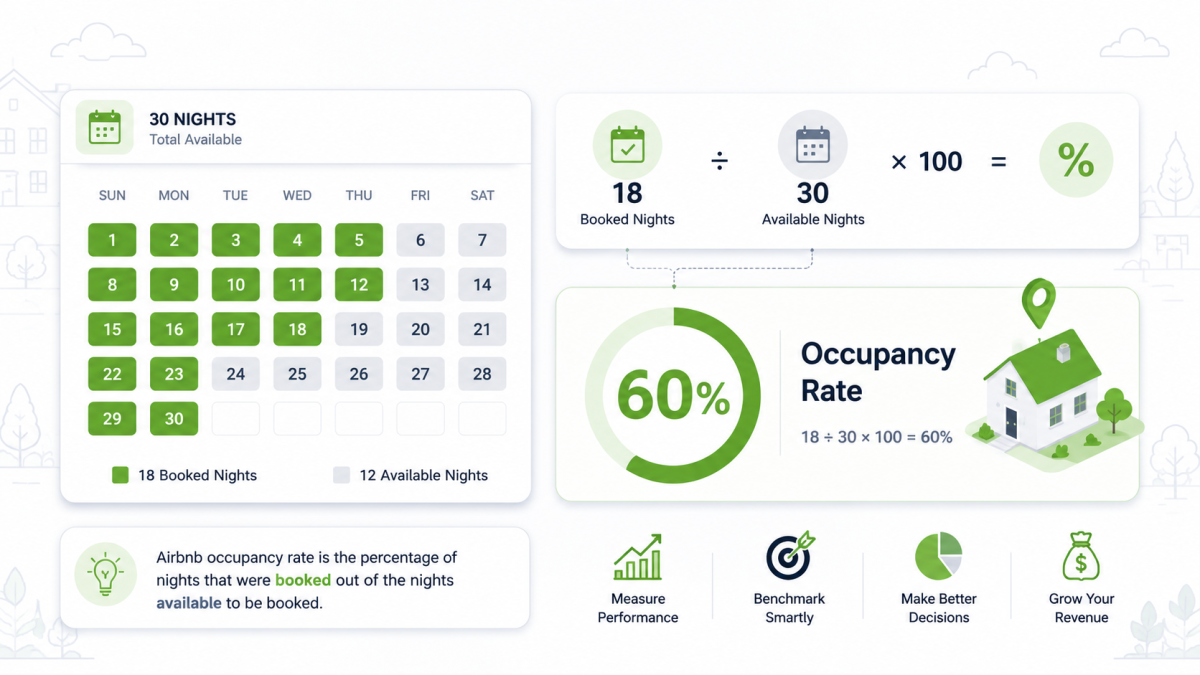
Airbnb occupancy rate equals booked nights divided by nights available to book, multiplied by 100. A “good” rate is not universal: compare your listing with similar local properties and your own revenue goals. Low occupancy can signal weak pricing or conversion; very high occupancy can signal underpricing.
What Is Airbnb Occupancy Rate?
Airbnb occupancy rate measures how much of your bookable inventory turns into booked nights. Airbnb’s own occupancy and rates performance guidance defines average occupancy rate as booked nights divided by total nights available to be booked across the relevant listings.
The basic formula is:
Airbnb occupancy rate = booked nights ÷ available nights × 100
For example, suppose a property was available for 300 nights and booked for 180:
180 ÷ 300 × 100 = 60% occupancy
That calculation sounds simple, but the time period matters. A 60% annual result can hide a nearly full peak season, a weak shoulder season, and several deliberately blocked weeks.
Start by separating three things:
- Booked nights: nights reserved by paying guests.
- Available nights: nights guests could actually book.
- Blocked nights: dates removed for personal use, maintenance, operational limits, or another reason.
Then compare the same definition across the same time period. Mixing a 30-day Airbnb dashboard view with a 12-month portfolio report creates noise before the analysis even begins.
What Is a Good Airbnb Occupancy Rate?
There is no universal “good” Airbnb occupancy rate that applies to every host. Geography, seasonality, bedroom count, property type, booking window, minimum stays, pricing, reviews, and local demand can all change what healthy performance looks like.
For one reference point, AirDNA’s occupancy benchmark analysis reports a 54.3% U.S. average while explicitly warning that averages can be misleading because performance varies by market, season, and property type.
That distinction matters. A national average should be a context point, not a target pasted onto every listing.
| Occupancy Pattern | What It May Indicate | First Question To Ask |
|---|---|---|
| Below comparable local listings | Price, conversion, visibility, or stay rules may be limiting demand | Are similar properties getting booked at comparable rates? |
| Near the local comparable set | Performance may be broadly in line with the market | Is revenue still meeting the property’s goal? |
| Above comparable listings | Strong demand or aggressive pricing may be filling dates faster | Are high-demand nights selling too cheaply? |
| Near sell-out for long periods | Pricing may be too low, or the property may have unusually strong demand | Could selected dates support a higher rate? |
The best benchmark is usually a relevant comparison set: similar location, property type, guest capacity, quality level, and season. Even then, occupancy should be read alongside average nightly rate, booking pace, length of stay, fees, and operating costs.
Pricing check: When the calendar looks healthy but the rate strategy is unclear, use RateGenie to test a more structured pricing workflow instead of treating occupancy as a standalone score.
Why a High Airbnb Occupancy Rate Is Not Always a Win
High occupancy feels reassuring because empty nights are visible. The problem is that booked nights can hide underpricing.
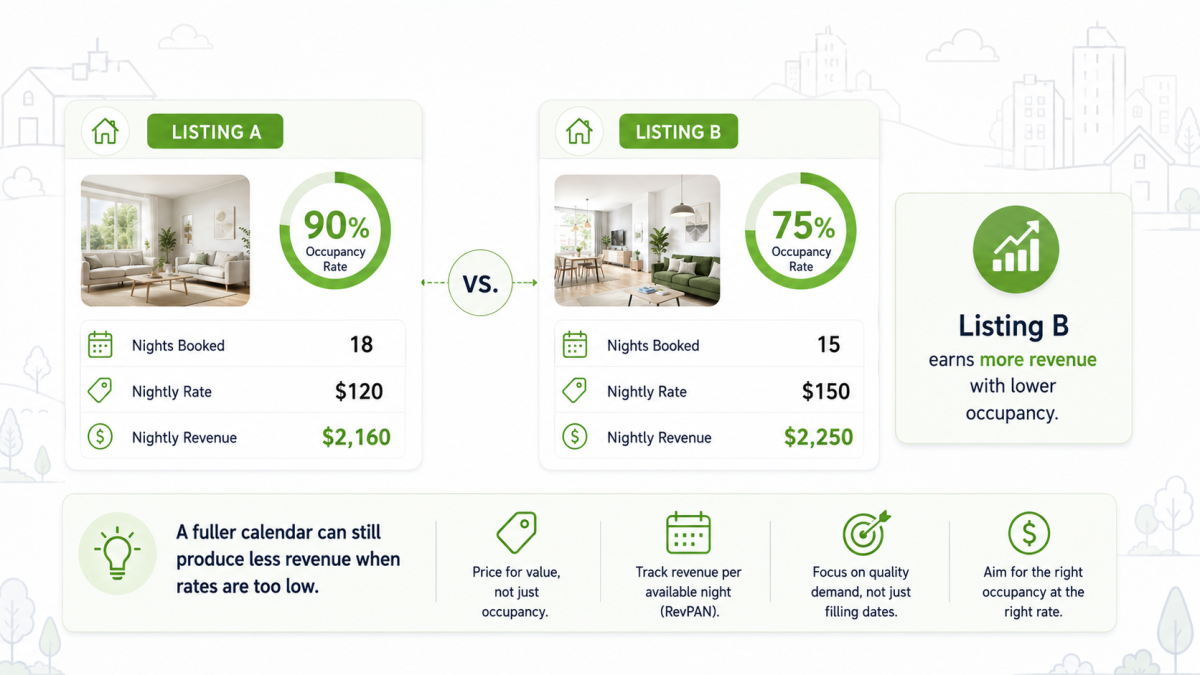
Consider two simplified 20-night periods:
- Listing A: 18 nights booked at $120 = $2,160
- Listing B: 15 nights booked at $150 = $2,250
Listing A has 90% occupancy. Listing B has 75% occupancy but produces more nightly revenue before cleaning costs, platform fees, taxes, and other expenses are considered.
The example does not prove that higher rates always win. It shows why Airbnb occupancy rate cannot answer a revenue question by itself.
A very high rate deserves a pricing review when:
- premium weekends consistently book far in advance;
- local events sell out before you adjust rates;
- guests rarely hesitate at the current price;
- occupancy is high but owner returns still feel thin;
- constant short stays are increasing cleaning and turnover pressure.
Before/After: Stop Treating Occupancy as the Goal
Before: “My target is 80% occupancy, so I should discount it until I get there.”
After: “My target is a healthier mix of booked nights, nightly rate, stay length, and operating workload, so I will test the constraint that is actually hurting performance.”
The shift is small but important. Occupancy becomes a diagnostic signal, not a scoreboard.
What Actually Moves Airbnb Occupancy Rate?
When performance is weak, lowering the price is only one possible response. The real constraint may sit somewhere else in the booking journey.
Pricing and booking pace
A listing can be too expensive for weak dates and too cheap for strong dates at the same time. That is why one permanent discount is usually a blunt fix.
Look at when nights book, not only whether they book. A Friday that fills 90 days ahead may need different treatment from a Tuesday that remains empty seven days before arrival.
Listing conversion
Traffic does not guarantee bookings. Photos, headline clarity, reviews, amenities, total price, cancellation terms, and the match between promise and property can all affect whether a shopper completes the reservation.
A cheaper rate will not fully solve a listing that fails to justify the price.
Availability and stay rules
Minimum stays can quietly remove otherwise bookable demand. A three-night minimum may work for a peak weekend but leave a two-night calendar gap that nobody can reserve.
The same applies to check-in restrictions, advance-notice settings, preparation time, and manually blocked dates. Review these rules before assuming the market has disappeared.
Channel exposure
Low Airbnb occupancy may be an Airbnb-specific problem rather than a property-demand problem. A property can have weak visibility on one platform while still matching demand elsewhere.
Expanding distribution can help test that possibility, but more channels also create more calendars, pricing points, and booking workflows to control. The goal is not to list everywhere blindly; it is to determine whether channel concentration is limiting otherwise viable demand.
How to Improve Airbnb Occupancy Rate Step by Step
1. Build a clean 90-day baseline
Record available nights, booked nights, nightly revenue, average stay length, and booking lead time for each property. Calculate occupancy from the same definition every time.
Do not start by changing five settings. First establish what is actually happening.
2. Compare like with like
Choose a small set of genuinely similar properties. Match location, bedroom count, guest capacity, quality level, and travel season as closely as possible.
Then ask whether your problem is unusual. If the whole local set is soft, aggressive discounting may only start a race to the bottom.
3. Compare price with booking pace
Look for dates that book much earlier or later than expected. A peak weekend selling immediately and a midweek gap sitting empty are different problems, so they should not receive the same price change.
For a deeper pricing workflow, use this guide to dynamic pricing for vacation rentals to separate demand signals, booking pace, rate boundaries, and manager judgment.
4. Fix the listing before using deeper discounts
Review the first photo, headline, amenities, fees, description, policies, and review profile. Ask whether the listing gives a guest enough confidence to book at the rate you are asking.
New properties have an additional trust problem because they lack social proof. The Tokeet guide to getting first bookings for a vacation rental with no reviews covers that launch-stage problem separately.
5. Test stay rules and channel mix
Check whether minimum stays, arrival restrictions, blocked dates, or preparation windows are making inventory unnecessarily hard to book. Then consider whether dependence on one OTA is limiting reach.
Before adding channels, understand the operational trade-off. This guide to listing a vacation rental on multiple platforms explains why broader distribution needs controlled calendar and workflow management rather than simple copy-and-paste expansion.
6. Run one 30-day test
Choose the strongest hypothesis and change one main variable.
Examples:
- Raise rates on dates that consistently book too early.
- Relax a minimum stay during a weak period.
- Replace the first five listing photos.
- Adjust near-term rates for specific calendar gaps.
- Test one additional booking channel.
Track the result for a defined period. If you change pricing, photos, discounts, stay rules, and distribution at once, you will not know which move affected the outcome.
Where RateGenie Fits Into the Occupancy Workflow
RateGenie is most relevant when the diagnosis points to pricing rather than a broken listing or an availability problem. Its current workflow supports pricing strategies and rules, can use occupancy and historical trends as inputs, and can update prices across connected channels.
The practical mechanism looks like this:
- Connect the listing → 2. define the pricing strategy → 3. set rules and property-level controls → 4. review occupancy and market signals → 5. send updated prices to connected channels.
That is different from saying software can manufacture demand. It cannot fix poor photos, weak reviews, the wrong property-market fit, or restrictions that make dates impossible to book.
What it can do is make pricing tests more systematic. Instead of noticing a gap, guessing at a discount, and forgetting what changed, an operator can define rules around conditions such as occupancy movement, last-minute timing, events, or specific days of the week and then review the outcome.
Workflow check: If manual rate changes are making occupancy tests inconsistent, explore RateGenie’s rule-based dynamic pricing approach.
When Your Occupancy Rate Says the Strategy Needs to Change
Sometimes the correct response is not a better discount. It is a different operating decision.
Low occupancy with weak listing conversion
Start with the offer itself. Improve what guests see, remove avoidable friction, and make sure the total price matches the experience being presented.
Low occupancy with strong reviews
Investigate pricing, booking restrictions, channel visibility, seasonality, and changes in local demand. Good reviews cannot compensate for every market or distribution problem.
High occupancy with weak revenue
Review underpriced dates, booking pace, discounts, stay length, and turnover cost. The property may be busy without capturing enough value from strong demand.
High occupancy with operational strain
Consider whether longer stays or slightly higher rates could reduce turnover while protecting revenue. More booked nights are not automatically better if every additional stay creates disproportionate cleaning, maintenance, and communication pressure.
Persistent underperformance despite repeated tests
Revisit the strategy itself. Some properties may need a different guest segment, a different channel mix, longer stays, a stronger direct-booking path, or a broader repositioning.
The point is not to abandon short-term rentals after one slow month. It is to recognize when the same failed test is being repeated under different names.
A Better Way to Read Occupancy
Airbnb occupancy rate is most useful when it helps you decide what to test next. It is much less useful when it becomes a universal target detached from price, revenue, seasonality, and workload.
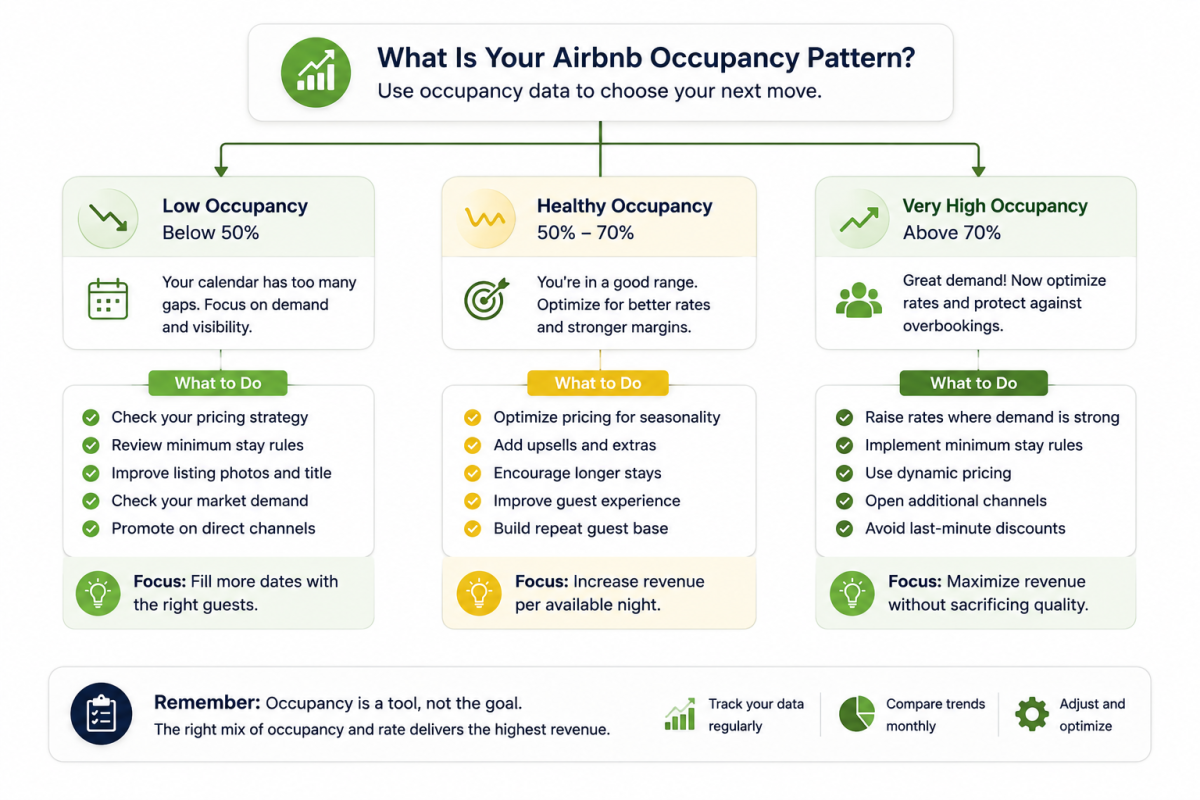
Use a simple decision sequence:
Low occupancy? Check market context → pricing → listing conversion → stay rules → channel exposure.
Very high occupancy? Check booking pace → underpriced dates → discounting → turnover pressure → revenue quality.
Healthy occupancy but weak profit? Stop trying to fill more nights until you understand the margin problem.
That approach replaces panic with diagnosis.
Conclusion
There is no magic Airbnb occupancy rate that every host should chase. The useful benchmark is a combination of comparable local performance, your own booking pace, the rate guests are paying, and the revenue and workload the property produces.
Calculate the number cleanly, diagnose the constraint, and run one controlled test at a time. That is how occupancy becomes a business signal instead of a number that triggers random discounts.
Pricing workflow: When the evidence points to inconsistent rate decisions rather than a demand or listing problem, see how RateGenie can structure pricing rules across your rental workflow.
FAQs
- What is a good Airbnb occupancy rate?
A good Airbnb occupancy rate is one that performs competitively against similar local listings while supporting your revenue and operating goals. National averages can provide context, but market, season, property type, pricing, and stay rules make a single universal target unreliable. - How do I calculate Airbnb occupancy rate?
Divide booked nights by nights available to be booked, then multiply by 100. For example, 60 booked nights out of 100 available nights equals a 60% occupancy rate. - Is 100% Airbnb occupancy good?
Not necessarily, because a near-full calendar can indicate that strong dates are priced below what demand might support. Review booking pace, nightly rate, discounts, and turnover costs before treating 100% occupancy as the best possible result. - How often should I review occupancy?
Review occupancy regularly enough to see booking pace without reacting to every isolated cancellation or empty night. A monthly review with deeper seasonal and quarterly comparisons gives many hosts a more stable view of performance. - Can dynamic pricing improve Airbnb occupancy?
Dynamic pricing can help adjust rates as booking conditions change, but it cannot guarantee higher occupancy or fix a weak listing. It works best when pricing rules are combined with good listing conversion, sensible availability settings, relevant market context, and human oversight.

Welcome to Tokeet’s Podcast — your trusted source for insights, trends, and strategies shaping the vacation rental industry. Each episode features expert interviews, data-driven analysis, and practical tips to help property managers grow their businesses, improve guest experiences, and stay ahead in a rapidly evolving market. Whether you’re new to short-term rentals or managing a large portfolio, tune in to stay informed and inspired.
A high Airbnb occupancy rate can look healthy while hiding underpriced nights, heavy turnover, or weak margins. A low rate can point to pricing, but it can also expose listing friction, stay restrictions, weak visibility, or poor conversion.
In this episode, we break down how to calculate occupancy correctly and why broad averages are often a weak benchmark. We also look at booking pace, comparable local listings, and the difference between a demand problem and a pricing problem.
The goal is not to chase one percentage. It is to use occupancy as a signal for the next decision.
Key Takeaways:
✅ Calculate occupancy from booked nights and available nights
✅ Compare similar listings in the same market and season
✅ High occupancy can signal underpricing
✅ Low occupancy does not always mean rates are too high
✅ Change one variable at a time and review the result
Related Links:
Company: https://www.tokeet.com/
Blogs: https://www.tokeet.com/blog/
Blog: Airbnb Occupancy Rate: Benchmarks That Actually Help 👉https://blog.tokeet.com/airbnb-occupancy-rate/
This is a public episode. If you would like to discuss this with other subscribers or get access to bonus episodes, visit podcast.tokeet.com